
Article by UniPi, Department of Computer Science. Author: Fernando De Nitto
Introduction
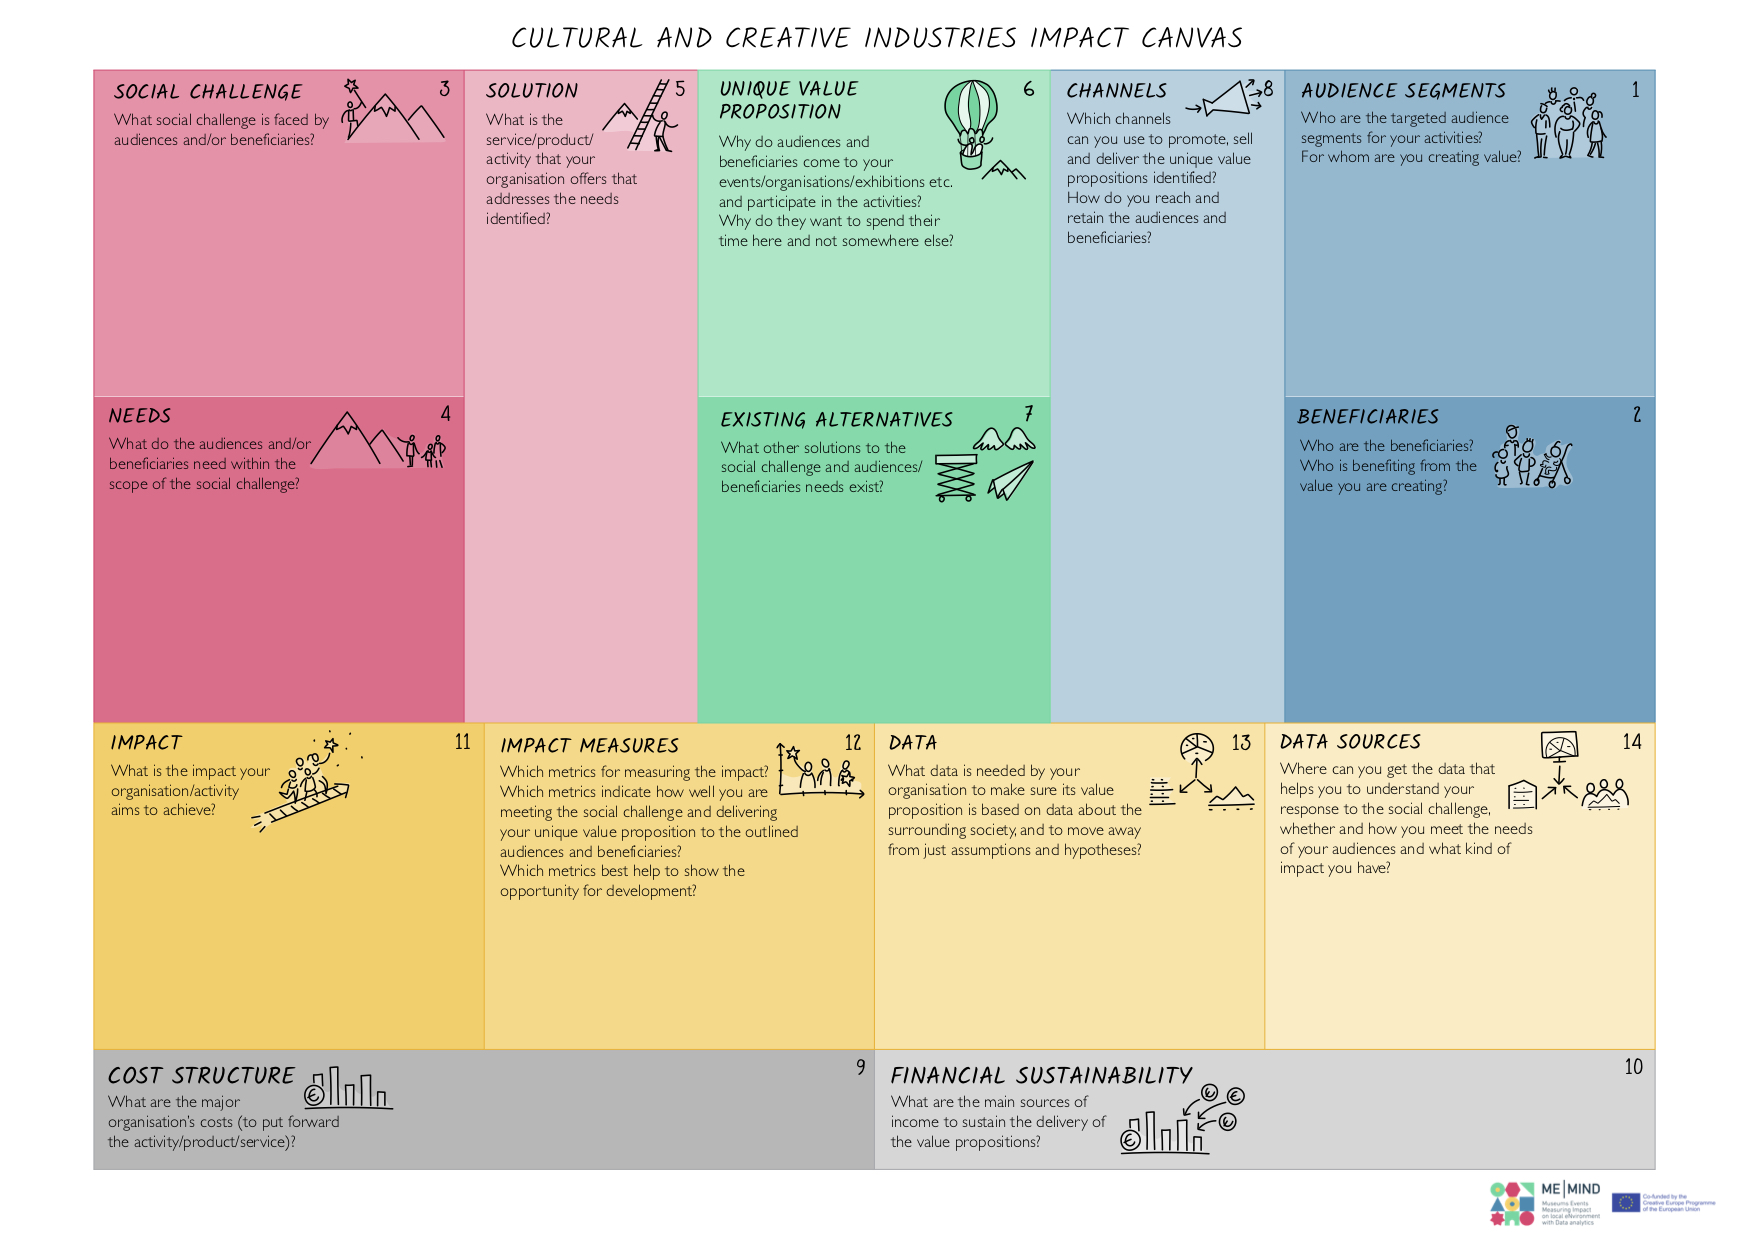
The purpose of the ME-MIND project is to enable small and medium-sized cultural and creative industries to evaluate their local impact through the collection, manipulation, cleaning and subsequent analysis of data. The two use cases of the project, the Estonian National Museum and the Internet Festival event, are very different examples with respect to their nature, the territorial extension, the way they are disseminated and the time span in which use cases are operational. In this post we describe the main characteristics of the two use cases, useful to understand the different approaches used in the data analysis, but also challenges and opportunities we faced working with the two use cases.The use cases
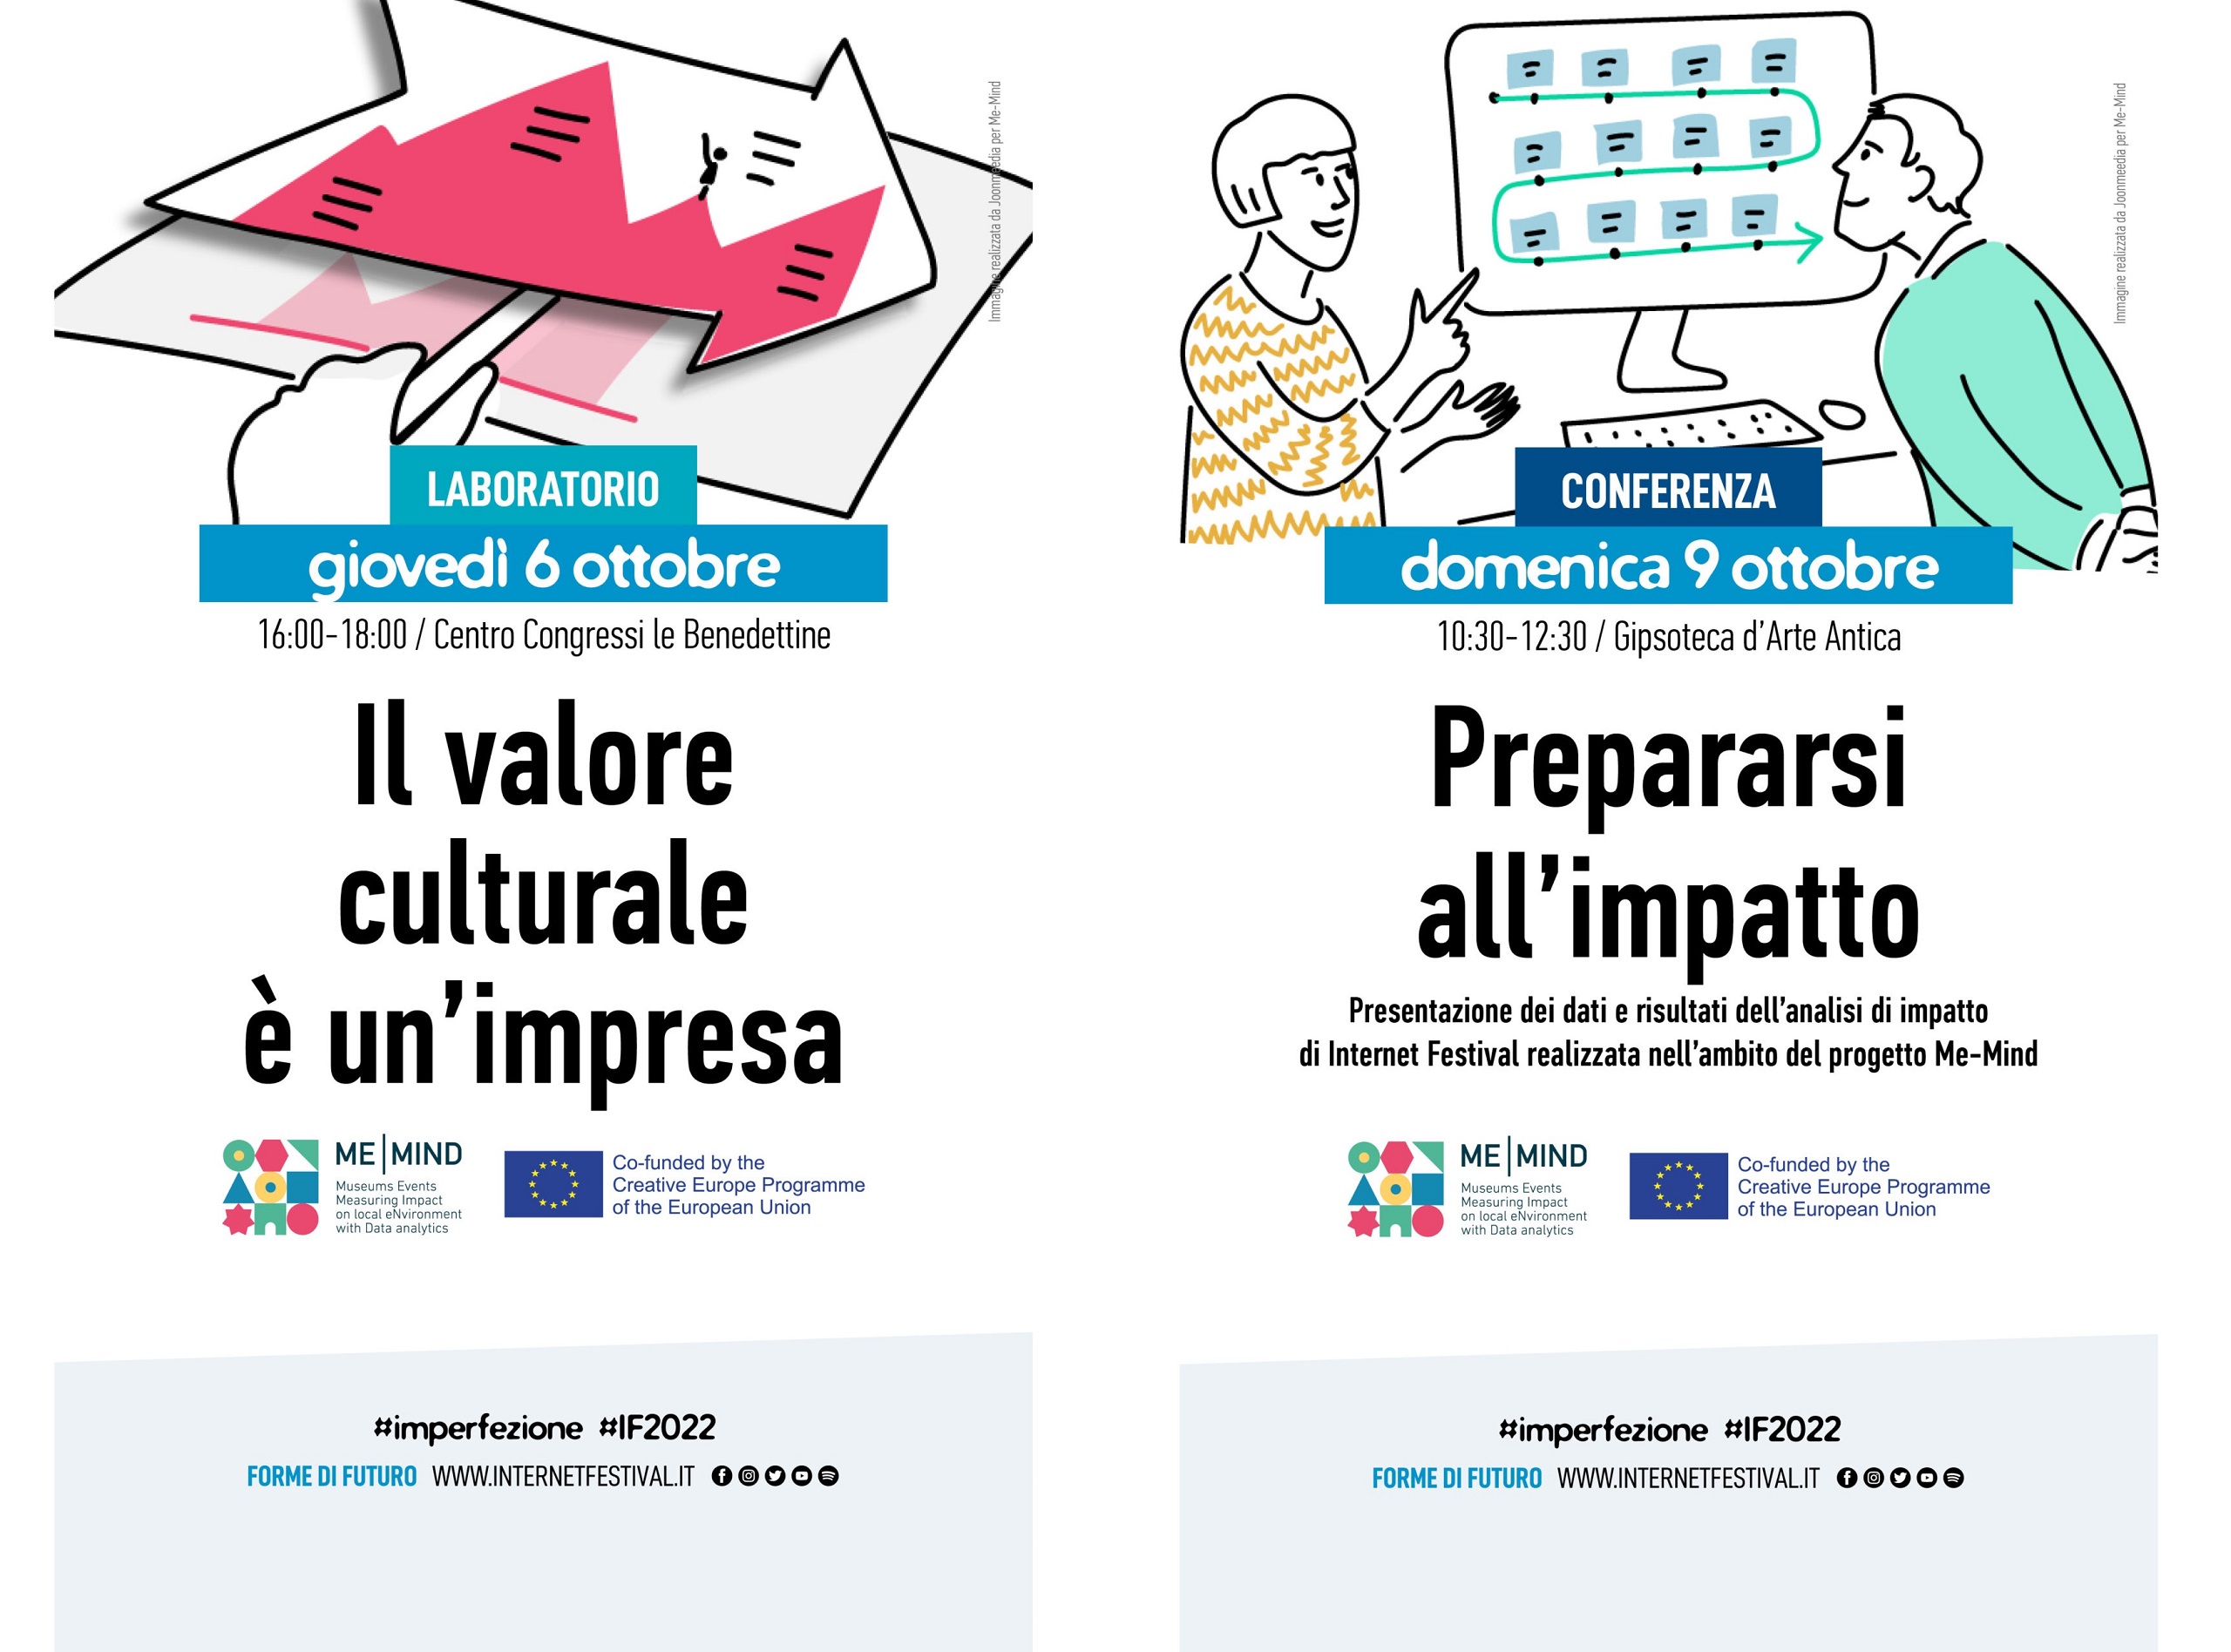
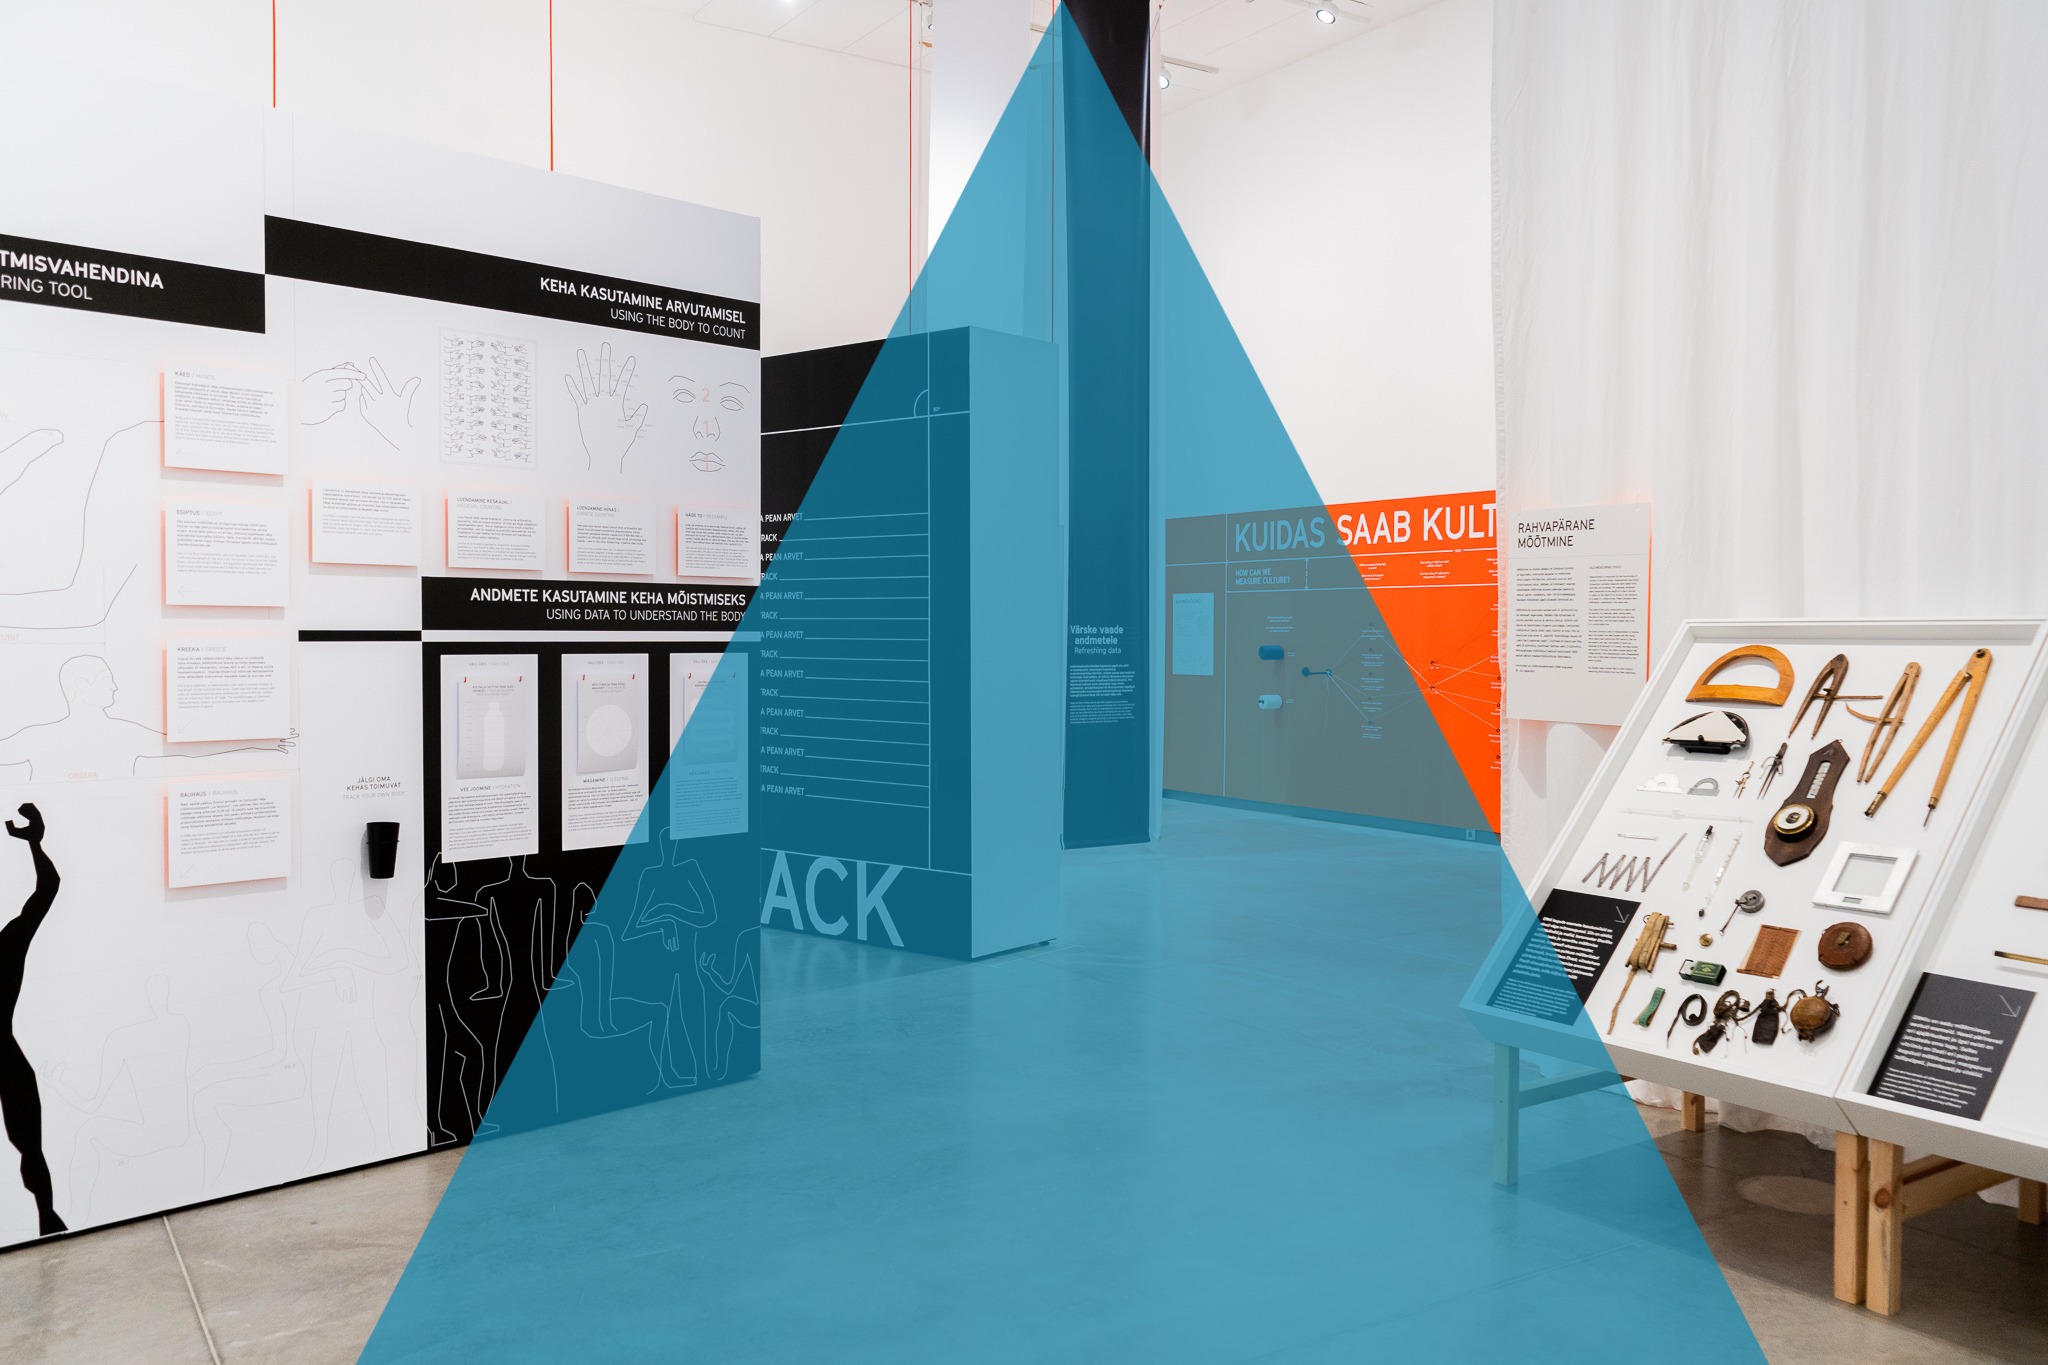
The Estonian National Museum, based in Tartu, is the reference point for the entire country of Estonia regarding Estonian history, customs, and traditions. In addition to the permanent exhibition, the museum hosts temporary exhibitions and events every year. The museum also represents an avant-garde model in terms of logistics and technologies proposed to the visitors, who can, for example, interact with electronic ink devices to obtain information in multiple languages. The Internet Festival event is an Italian national event (of 4 days) based in Pisa, organised by Fondazione Sistema Toscana every year in October. The festival is made up of hundreds of events scattered in various locations within the city of Pisa. Every year all the events, while dealing with substantially different themes, are linked to a common keyword that represents the common thread of the entire annual edition.Data collection: similarities, differences, challenges and opportunities in the two use cases
The profound diversity of the two use cases intrinsically defines the challenges of data analysis to be carried out and more generally represents a challenge for the project, which must find a common pattern to propose to other small and medium-sized cultural and creative organisations. The collection of the data itself represented the first challenge of the data analysis for both the use cases. Initially, the two use cases collected their internal data such as financial data, data on their attendees and anything else that could be extracted from excel files or internal databases. In the case of the Estonian National Museum, we extracted technical data from the museum devices that relates the interactions of the individual tickets with the devices. Furthermore, we collected external data. In the case of the Internet Festival, we obtained external data from various enterprises, bodies and organisations operating in the city of Pisa. While other data came from the questionnaires distributed to the audience during the 2021 festival edition. Finally, for both use cases, we adopted data extrapolation techniques, in particular from the TripAdvisor platform. Once all the data were collected, we reflected on which analyses were the most useful and consequently what deductions could be made. Three main questions guided our data analysis:- Is it possible to get useful information about the visitors using questionnaires?
- Is it possible to correlate internal data with external data in order to better observe how the two use cases are impacting their local environment?
- Can purely technical data say something about the visitor behavior within a museum?
Internet Festival
For the Internet Festival, the most important data analysis concerned the data collected from external sources, such as- The hotel attendance data was obtained through the extraction of data from the TripAdvisor platform
- The data on the flow of car traffic provided by the Tuscan region
- The questionnaires filled in by the participants in the event
- The attendance data provided by the museums of the city di Pisa
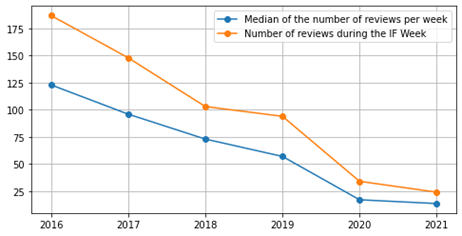 Weekly Review of Hotel in Pisa from 2016 to 2021
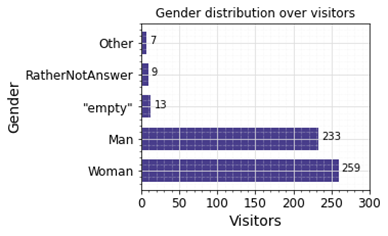 Visitors’ Gender Distribution during Internet Festival 2021
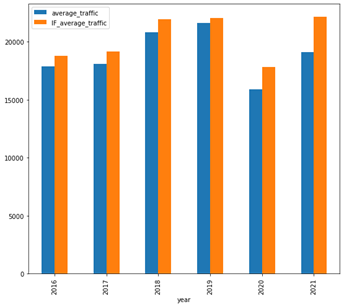 Results of Traffic Sensor Data Analysis
Estonian National Museum
Regarding the use case of the Estonian National Museum, we focused on analysing the technical data obtained from the internal logs of the interactive devices installed inside the museum. In fact, museum visitors can view a lot of information, in different languages, thanks to their ticket. The devices, on the other hand, record any type of interaction for each individual ticket. Each data within the dataset refers to a single interaction of a single ticket with a particular device. One difficulty with this part of the data analysis was the format of the data itself: most of the technical data recorded by the devices was in the form of codes. In addition to the timestamps, most of the codes were unusable for data analysis purposes. Fortunately, thanks to the correspondence tables provided by the Estonian National Museum, it was possible to extrapolate from the purely technical data the following derived data:- Date and time of the interactions of the single ticket with a specific device.
- Language used by the single ticket in interacting with the device.
- Visited position, with respect to the museum, during the interaction of a ticket with a specific device.
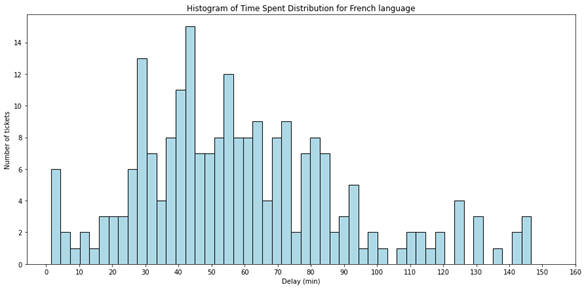
- The time spent by a single ticket inside the museum.
- The most requested and visited topics within the permanent exhibition of the museum.
- The path inside the museum of every single ticket.
 The analysis of the topics that have received the most interactions within the museum are shown (partially) in the following figure. The data were grouped by single device, and for each of these the unique interactions during the whole year examined by the dataset were counted.
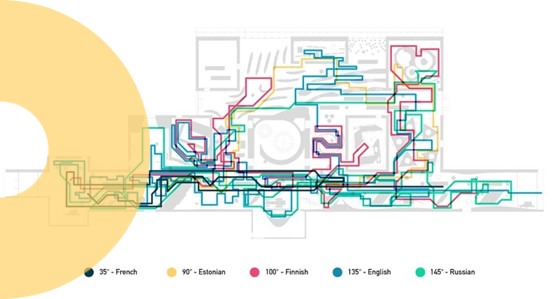
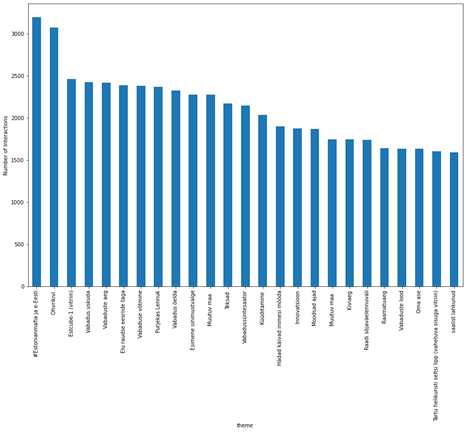 Finally, by crossing the data of the tickets and devices, we calculated the path that each ticket followed inside the museum. By dividing the tickets according to the language dimension it was possible to show different behaviours within the museum with respect to the different language used to interrogate the devices. An example of these paths, divided by language, is shown in the following figure designed by our partner Domestic Data Streamers (see our page Experience data).
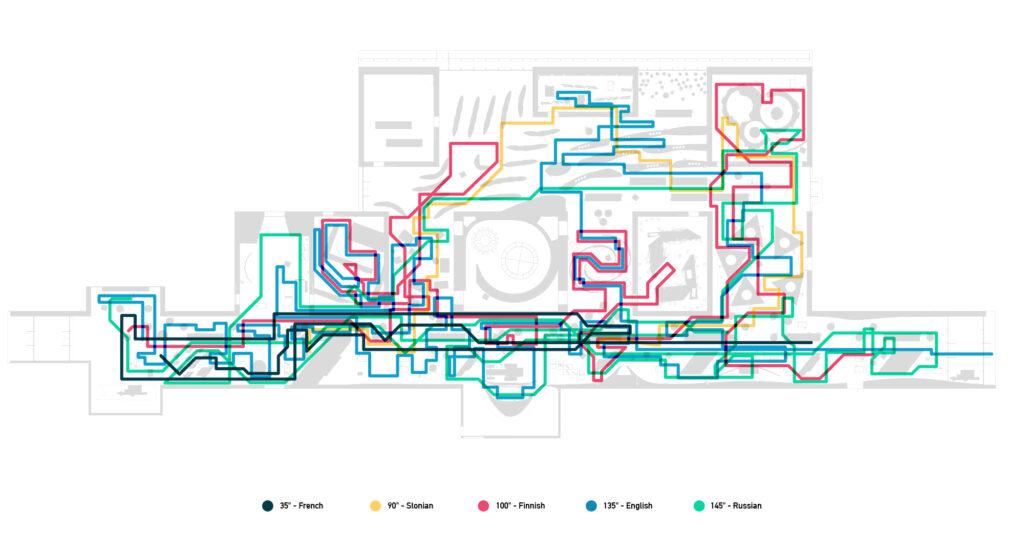 Some difficulties in analysing the data of this use case concerned the presence of some data with values out of the ordinary and certainly due to some (few) incorrect recording by the devices. These data were simply discarded after calculating confidence intervals in line with the context of the use case.